
Let’s get straight to it. Think of KPIs as the most critical dials on your car's dashboard. You've got your speedometer, your fuel gauge, and that all-important engine temperature light. Sure, the car is tracking dozens of other things, but these are the vital signs you absolutely need to know if you're going to get where you're going safely and on time.
Key Performance Indicators (KPIs) do the exact same job for your business.
So What Are KPIs Anyway?

Simply put, a KPI is a measurable value that shows you, in no uncertain terms, how well your company is hitting its most important business goals. They aren't just random numbers plucked from a report; they're the carefully chosen few that build a direct bridge between your team's day-to-day work and your biggest strategic ambitions.
Your business churns out a mountain of data every single day—website clicks, social media likes, support tickets, you name it. But only a tiny fraction of that data truly measures what matters. Those are your KPIs. They cut through the noise, get everyone pulling in the same direction, and make your big-picture goals feel real and achievable.
KPIs vs Metrics: What Is the Difference?
This is a point that trips up a lot of people: every KPI is a metric, but not every metric qualifies as a KPI. A metric just measures something that's happening. A KPI, on the other hand, measures how you're performing against a make-or-break business goal.
Let's make that clearer with a quick comparison.
| Aspect | Business Metric | Key Performance Indicator (KPI) |
|---|---|---|
| Purpose | Tracks an activity or process. | Measures performance against a strategic goal. |
| Focus | Broad and operational. | Narrow, focused on what's critical. |
| Example | Number of website visitors. | Conversion rate from website visitors to customers. |
| Impact | Informational; good to know. | Actionable; directly drives decisions. |
| Connection | Loosely tied to business health. | Directly linked to business success or failure. |
Getting this distinction right is absolutely vital. If you focus on the wrong numbers, you risk your team chasing "vanity metrics"—like social media followers—that look great on paper but do nothing for your bottom line. To get a fuller picture, it's worth exploring the wider world of Business Performance Indicators, which covers the whole spectrum of measurement.
A KPI should be a compass, not just a speedometer. It needs to tell you if you're heading in the right direction, not just how fast you're going.
KPIs in Action Across Ireland
This isn’t some abstract concept from a global business textbook; it’s happening right here in Ireland. Irish businesses have really embraced KPIs as fundamental tools for sharpening their performance. A 2021 report showed that over 70% of Irish SMEs are now actively using KPIs to keep an eye on everything from how efficiently they're operating to whether they're hitting their growth targets.
Across the board, the most popular KPIs in Ireland tend to be financial ones like profit margins and customer acquisition costs, but operational measures like employee productivity are just as common.
Ultimately, picking the right KPIs is about finding the numbers that tell the most important story about where your business is today—and where it's headed tomorrow.
Learning the Different Types of KPIs
Before we go any further, you need to understand that not all KPIs are created equal. They each tell a different part of your business story, and mixing them up is a common mistake.
Think about it like getting fit. Some numbers tell you what you’ve already achieved, while others give you clues about where you’re headed. This is the fundamental difference between the two most important types of KPIs: lagging indicators and leading indicators. Getting your head around this is the first real step to building a measurement system that actually works.
Lagging Indicators: A Look in the Rearview Mirror
A lagging indicator is exactly what it sounds like—it measures performance that has already happened. It’s the result, the outcome. In our fitness analogy, this is stepping on the scales at the end of the week. That number is a direct result of your diet and exercise over the last seven days. It’s an output metric.
For a business, some classic lagging indicators include:
- Monthly Recurring Revenue (MRR): The predictable revenue you banked last month.
- Customer Churn Rate: The percentage of customers who left you over a given period.
- Net Profit Margin: How much actual profit you made from your total revenue.
These numbers are absolutely essential. They tell you, in black and white, whether your strategies paid off. But they have one big flaw: you can’t change them. The performance is already in the history books. This is where their forward-looking cousins come in.
Leading Indicators: Your Crystal Ball for Performance
A leading indicator, on the other hand, is a metric that helps predict future results. It’s an input metric—it tracks the actions and behaviours that drive the outcomes you want.
Back to our fitness goal, your leading indicators would be things like the number of workouts you log each week or your average daily calorie intake. These are the levers you can pull right now to influence that number on the scales next Friday. They give you a chance to see what’s coming and adjust your course before it’s too late.
In a business setting, leading indicators could be:
- Number of Sales Demos Booked: More demos this week almost always leads to more closed deals next month.
- Free Trial Sign-up Rate: This is a strong predictor of how many new paying customers are in the pipeline.
- Customer Satisfaction (CSAT) Score: A consistently high CSAT suggests your churn rate is likely to stay low.
A business that only tracks lagging indicators is like driving a car while looking exclusively in the rearview mirror. You know exactly where you've been, but you have no idea what's coming.
The sweet spot is a healthy mix of both. Lagging indicators confirm you’ve reached your destination, while leading indicators are the satnav guiding you there, helping you dodge traffic jams and wrong turns along the way.
High-Level vs. Focused KPIs: Different Views for Different Crews
Beyond the leading vs. lagging split, KPIs also operate at different altitudes. The CEO doesn’t need to see the same numbers as a junior marketer, and vice versa.
High-level KPIs, often called strategic KPIs, are the big-picture numbers that the C-suite obsesses over. They’re almost always lagging indicators tied to the overall health of the business—think annual revenue growth, market share, or customer lifetime value (CLV). These tell the grand story of the company's journey.
In contrast, operational KPIs are the nitty-gritty metrics that individual teams live and breathe day-to-day. A product team, for instance, might be laser-focused on its daily active users (DAU) or the feature adoption rate for a new update. These are typically leading indicators that have a direct impact on the bigger strategic goals.
It’s all connected. If the product team successfully boosts daily active users (an operational, leading KPI), it should eventually drive up monthly recurring revenue (a strategic, lagging KPI). This alignment is critical. It ensures everyone’s daily grind is pushing the entire company in the right direction.
How to Choose KPIs That Actually Matter
Knowing what KPIs are is the easy part. The real challenge? Picking the ones that will actually move your business forward. It can feel like you’re drowning in a sea of data, trying to find the one or two numbers that truly count.
If you don't have a solid game plan, you'll end up chasing "vanity metrics"—those flashy numbers that look great in a presentation but do absolutely nothing for your bottom line. The secret isn't just about tracking numbers; it’s about choosing indicators that are welded directly to your most important business goals.
Let's break down three proven frameworks to help you cut through the noise.
Start with the SMART Framework
Your first port of call should always be the SMART framework. Think of it as a quality check for any potential KPI. It’s a beautifully simple tool that stops you from adopting vague, unhelpful metrics.
Every single KPI you decide to track must be:
- Specific: It needs to be crystal clear. "Improve customer happiness" is fuzzy. "Increase our Net Promoter Score (NPS) from 35 to 50" is specific.
- Measurable: You have to be able to put a number on it. "Boost brand awareness" is just wishful thinking, but "Increase organic search traffic by 20%" is a target you can track.
- Achievable: Set realistic goals. Aiming to triple your revenue in a month might sound ambitious, but if it’s totally out of reach, it’ll just crush team morale.
- Relevant: Does this metric actually tie into your big-picture goals? Tracking daily social media likes is pointless if your main objective is to reduce customer churn.
- Time-bound: Every KPI needs a deadline. "Increase sales" is a dream; "Increase monthly sales by 15% by the end of Q4" is a plan.
Using the SMART criteria is the foundation. It ensures every KPI you track is focused, actionable, and tied to a meaningful business outcome.
Don't let your team chase metrics that don't move the needle. A SMART KPI isn't just a number; it's a clear instruction on what to do, by when, and why it's important.
Find Your North Star Metric
Once you've got the SMART basics down, it’s time to zoom out. A North Star Metric (NSM) is the single, overarching metric that best captures the core value your product delivers to your customers. It's the one number that, if it goes up, proves your company is on the right path for long-term, sustainable growth.
Put it this way: if your entire company could only focus on improving one number, what would it be? For Facebook, it was "monthly active users." For Airbnb, it's "nights booked."
Your NSM gives the entire organisation a compass, making sure every department—from marketing to product to sales—is pulling in the same direction. Figuring this out helps you prioritise all the smaller, supporting KPIs that feed into it.
Align KPIs with OKRs
The Objectives and Key Results (OKR) framework is a goal-setting system that pairs perfectly with KPIs. Here’s how they fit together:
- Objective: This is your big, ambitious, qualitative goal. Something like, "Become the most loved accounting software for Irish freelancers."
- Key Results: These are the measurable outcomes that prove you’ve actually hit your objective. Your KPIs often become your Key Results.
So, for that objective, your Key Results (and KPIs) might look something like this:
- Increase our Net Promoter Score from 40 to 60.
- Achieve a customer retention rate of 95%.
- Reduce customer support ticket response time to under 1 hour.
This process guarantees your KPIs aren't just numbers floating around in a spreadsheet. They are directly wired into the company's most critical strategic goals. This alignment provides context, which is everything when it comes to making smart decisions. As our guide on why context matters in business explains, numbers without a story behind them can be dangerously misleading.
This diagram shows the relationship between leading indicators (the actions you take) and lagging indicators (the results you get).
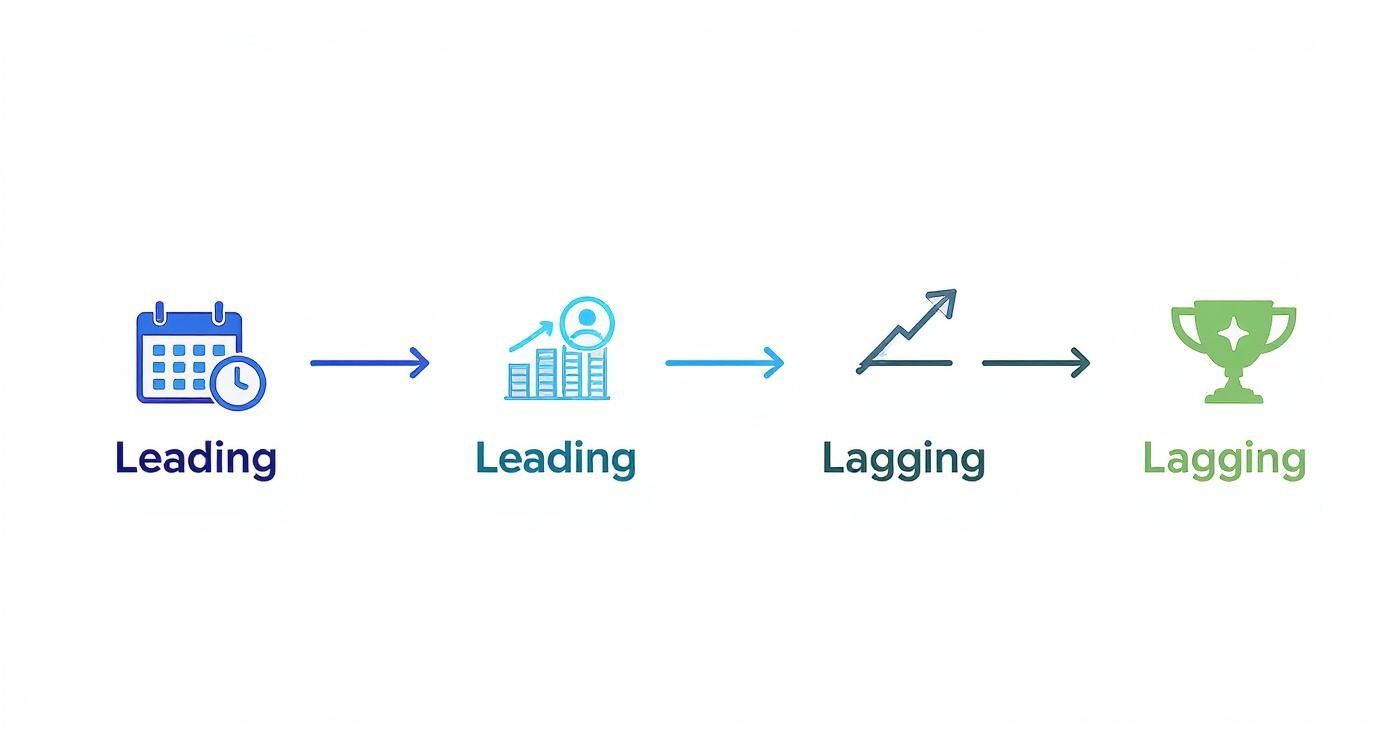
You can see how the predictive actions, or leading indicators (like booking more sales demos), directly influence the final outcomes, or lagging indicators (like hitting your revenue target).
And there’s proof that this structured approach works. A 2023 ESRI report found that Irish SMEs actively tracking at least five operational KPIs saw revenue growth rates 15% higher than those that didn't. What’s more, those same firms reported a 10% reduction in employee turnover, proving that clear goals don’t just boost performance—they improve satisfaction, too.
Real-World KPI Examples: What Actually Gets Measured
Theory is great, but seeing KPIs in the wild is where it all clicks. What matters to an online retailer is completely different from what a hospital tracks. The best metrics are always tied directly to the mission of the business.
Let’s get practical and look at a few examples. Seeing how different sectors define and measure success will help you zero in on what’s truly important for your own work.
Artificial Intelligence and Machine Learning
The AI world isn't just about building slick algorithms; it's about delivering results that are reliable, fast, and dead-on accurate. Teams in this space are obsessed with performance, and their KPIs show it.
Here’s what they’re watching:
- Model Accuracy Rate: This is the big one. It's the percentage of predictions the AI gets right. For an AI that reads medical scans, an accuracy of 99% isn't just a goal; it's the bare minimum.
- Prediction Latency: How fast can the model make a call? For a self-driving car, that decision has to happen in milliseconds to avoid a collision. Every microsecond counts.
- False Positive/Negative Rate: This gets into the type of mistake the model is making. Think of a security system. A few false alarms (false positives) are annoying, but missing a real threat (a false negative) is a catastrophe.
Healthcare Services
In healthcare, it's all about patient outcomes and keeping the operation running smoothly. The KPIs here are less about pure profit and more about people's well-being, reflecting a deep commitment to quality care.
Common measures include:
- Average Patient Wait Time: This tracks the time from a patient's arrival to seeing a doctor. It’s a huge indicator of efficiency and a massive factor in how patients feel about their experience.
- Bed Occupancy Rate: This helps hospital managers juggle resources. It's about having enough beds ready for new patients without having empty wards draining the budget.
- Hospital Readmission Rate: This is the percentage of patients who end up back in hospital within 30 days of being sent home. A low number is a great sign of excellent care and solid follow-up planning.
Logistics and Supply Chain
Logistics is the engine of modern commerce, and it runs on pure precision. Success means getting the right thing to the right place at the right time, every single time. Every minute and every parcel is tracked.
In logistics, a KPI isn't just a number on a spreadsheet; it’s a promise to a customer. A high on-time delivery percentage is a direct measure of your reliability and the trust people have in your brand.
Here are the numbers that logistics pros live and die by:
- On-Time Delivery (OTD) Percentage: What portion of orders arrived when you said they would? For a massive e-commerce company, letting that number slip from 99% can create thousands of angry customers overnight.
- Order Accuracy Rate: Was the order filled, shipped, and delivered without a single mistake? This one directly hits customer satisfaction and the costs of handling returns.
- Inventory Turnover: How quickly are you selling and replacing your stock? A high turnover is a sign of healthy sales and smart inventory management, which is absolutely vital for protecting and understanding your cash flow.
Creative and Digital Technology
For software companies, app developers, and anyone building a digital platform, it's all about the user. The KPIs are laser-focused on engagement, happiness, and long-term loyalty. It’s one thing to get someone to sign up; it’s another to get them to stick around and actually use what you've built.
For a deeper dive into this, Salesmotion has a brilliant Lead Generation Key Performance Indicators Guide that’s worth a read.
Here’s what these teams are tracking:
- Customer Lifetime Value (CLV): This is a forecast of how much revenue you can expect from one customer over their entire relationship with you. It’s the number that tells you how much you can afford to spend to get a new customer in the door.
- Daily Active Users (DAU): A simple but incredibly powerful metric. It tells you how relevant your product is to people on a daily basis.
- User Engagement Score: This is often a custom-built metric that blends things like session time, how many features someone uses, and how often they log in. It gives you a single, holistic score for how invested a user is.
Sample KPIs by Industry
To pull this all together, here is a quick-glance table showing how different industries might approach their KPIs. It’s a simple way to see how the core mission of a sector shapes what it decides to measure.
| Sector | Example KPI 1 | Example KPI 2 | Why It Matters |
|---|---|---|---|
| Artificial Intelligence | Model Accuracy Rate | Prediction Latency | Measures correctness and speed, which are crucial for trust and real-time application. |
| Healthcare | Patient Wait Time | Hospital Readmission Rate | Focuses on operational efficiency and the quality of patient care and recovery. |
| Logistics | On-Time Delivery % | Inventory Turnover | Tracks delivery promises and financial health through efficient stock management. |
| Creative Tech | Customer Lifetime Value (CLV) | Daily Active Users (DAU) | Gauges long-term business sustainability and how 'sticky' or essential the product is. |
As you can see, the "right" KPI is never one-size-fits-all. It's always a reflection of what success truly looks like for that specific business.
Bringing Your KPIs to Life with Dashboards

Choosing the right KPIs is a huge step, but it’s only half the journey. If your carefully selected metrics are just sitting in a complex spreadsheet somewhere, they aren't doing anyone any good. To really put them to work, you need to bring them to life.
This is where KPI dashboards come in. A well-designed dashboard takes your raw data from a list of numbers and turns it into a clear, compelling story that anyone can understand in seconds. Think of it as the difference between a dense report and a live pulse check on your business's health.
Designing a Dashboard That Tells a Story
The goal isn’t to cram every metric you can think of onto one screen. That just creates a mess. A great dashboard is focused, intuitive, and built to answer the most important questions at a glance.
Here are a few simple principles for creating dashboards that actually work:
- Focus on the Vitals: Just like a pilot’s cockpit, your dashboard should only show the most critical info needed to make decisions. Stick to the 3-5 KPIs that truly matter for that specific team or goal.
- Choose the Right Visuals: A line chart is perfect for tracking a trend over time, a bar chart is great for comparisons, and a single, big number is brilliant for a headline KPI like monthly recurring revenue. Match the visual to the data's story.
- Provide Context: A number on its own is pretty meaningless. Is a 7% conversion rate good or bad? Your dashboard needs to add context, like showing last month’s performance or the target you’re aiming for.
A dashboard should offer clarity, not complexity. If someone can't grasp the key takeaways in 30 seconds, the design has failed. It's a tool for quick insight, not deep analysis.
Beyond the Visuals: Data Governance and Privacy
An effective KPI strategy is about more than just pretty charts; it’s a whole system built on a foundation of trust. Two of the biggest pillars of that foundation are data governance and data privacy.
Data governance is all about making sure your data is accurate, reliable, and consistent. It's the set of rules that guarantees the numbers on your dashboard are telling the truth. Without it, you could end up making major business decisions based on flawed information. Digging into the world of AI and data analytics really highlights how vital strong governance becomes with complex data.
Data privacy, on the other hand, is about collecting and handling that data ethically and legally. With regulations like GDPR, how you manage customer information is under a microscope. This means being upfront about what you’re tracking and ensuring you have the right permissions.
Ensuring Compliance and Building Trust
This disciplined approach isn’t just for private companies. In the public sector, Irish local government bodies have been using KPIs to drive transparency and efficiency for years. By 2013, it was standard practice to use metrics for service delivery and citizen satisfaction. For instance, local authorities track KPIs like waste collection completion rates (aiming for over 95%) and the average time it takes to process planning permissions. You can explore a huge list of local government KPIs and scorecard measures to see this in action.
Ultimately, a successful KPI programme is a complete system. It's a mix of clear goals, thoughtful visualisation, and a rock-solid commitment to data integrity and privacy. When all these pieces click into place, you create a culture of accountability and give your team the power to make smarter decisions, faster.
Common KPI Mistakes and How to Avoid Them
Even when you have the best intentions, it's surprisingly easy to get your KPI strategy wrong. So many organisations fall into the same predictable traps, turning what should be a powerful tool into a source of complete confusion.
The good news? These mistakes are entirely avoidable. Once you know what to look for, you can build a KPI system that's focused, flexible, and genuinely useful.
Mistake 1: Chasing Vanity Metrics
This is the big one, the most common mistake of all. Vanity metrics are those numbers that look fantastic on a slide deck but have zero real connection to your business’s health or long-term success. Think website page views, social media followers, or total app downloads.
These numbers are a breeze to measure and often go up and to the right, which gives everyone a nice, warm feeling. But a million page views don't mean a thing if your revenue is flat. To steer clear of this, always ask yourself one critical question: "Does this number directly help us achieve our core business goals?" If the answer is a shaky "maybe" or a flat "no," it's not a KPI.
Mistake 2: Setting Far Too Many KPIs
When you first start tracking performance, the temptation is to measure absolutely everything. This is a fast track to 'analysis paralysis,' where your team is so swamped with data they can't see the wood for the trees.
Focus is everything here. A business trying to improve twenty different KPIs at once will likely end up improving none of them.
A KPI strategy with more than a handful of core indicators isn't a strategy at all; it's a to-do list. True clarity comes from ruthless prioritisation, not exhaustive measurement.
The fix is to limit yourself. Aim for 3-5 high-level KPIs for the entire company, and maybe a similar number for each department. This forces everyone to concentrate on the metrics that actually move the needle, ensuring you're all pulling in the same direction.
Mistake 3: Forgetting to Evolve Your KPIs
Your business isn't static, so why would your KPIs be? The metrics that mattered when you were a two-person startup are rarely the same ones you’ll need when you hit fifty employees.
A classic blunder is setting your KPIs once and then letting them gather dust for years. As your strategy shifts, your measurement system has to shift with it. A KPI that was once vital can easily become irrelevant as the market changes or your customers' needs evolve.
To avoid getting stuck, build a regular review into your process. Revisit your KPIs every quarter, or at least once a year, to make sure they are still:
- Relevant to where your business is heading now.
- Actionable for your teams on the ground.
- Driving the right behaviours across the organisation.
This simple habit keeps your KPIs a living, breathing part of your strategy, guiding you toward future success instead of anchoring you to the past.
A Few Final Questions About KPIs
Right, let's tie this all together by looking at some of the questions that always seem to crop up when teams start getting serious about KPIs. Nailing these details will make you much more confident when you start putting all this into practice.
How Many KPIs Should a Business Actually Track?
There's no single right answer, but I can tell you one thing for sure: less is more. When you throw too many numbers at people, they lose focus. You end up with analysis paralysis, which is the exact opposite of what we're aiming for.
As a general guide, try to stick to 3-5 major KPIs for the entire business. Think of these as your headline acts. Then, each team or department can have its own 3-5 KPIs that feed directly into those bigger, company-wide goals. This way, everyone knows what they're responsible for and how their work connects to the main objective.
What's the Real Difference Between a KPI and an OKR?
Great question. It's easy to get these two mixed up, but they're actually designed to be partners. Here’s how I think about it: your Objective (the 'O' in OKR) is the big, aspirational thing you want to achieve. It's the "where are we going?" part, like "Become the go-to brand for sustainable products in Ireland."
The Key Results (the 'KRs') are the proof that you're getting there. And this is where your KPIs slot in perfectly. Your Key Results are often your KPIs. So, a KPI like "Achieve a 25% market share" could be a Key Result for that "Become the go-to brand" Objective.
The simplest way to put it is this: OKRs give you the destination and the reason for the journey. KPIs are the signposts along the road telling you if you're on track.
How Often Should We Be Looking at Our KPIs?
It really depends on what you're measuring. Different metrics have different heartbeats, so a one-size-fits-all approach to reviewing them just doesn't work.
Day-to-day operational stuff, like website traffic or daily sales, needs a frequent check-in—maybe even daily, but at least weekly. This lets you react quickly if something's off. But the big, strategic KPIs like customer lifetime value or brand awareness? Those are slower-moving beasts. A monthly or quarterly review is usually plenty to see meaningful trends and make informed decisions.
Can a KPI Be Non-Financial?
Of course! And honestly, some of the most important ones are. Focusing only on the money is like driving while only looking at the fuel gauge—you're missing everything else happening on the road.
Think about metrics like your Customer Satisfaction (CSAT) score, Employee Engagement, or the classic Net Promoter Score (NPS). These numbers tell you about the health of your customer relationships and the morale of your team, which are massive drivers of your financial performance down the line. They're the leading indicators of future success.
Discover more from Scott Dylan
Subscribe to get the latest posts sent to your email.